The Impact of Website Speed on User Behavior – research
Below are the results of a study aimed at understanding how internet users approach slow-loading websites – what their expectations are regarding page load times and how they react to slow websites.
INFO: The study was conducted on a representative group of adult U.S. citizens commissioned by the Prehost.com by the research agency TGM Research using the CAWI technique on a sample of N=1087 in June 2024.
We encourage the wide use of the study results to raise awareness about the impact of website speed and performance on online business. All materials – (infographics, data, tables, etc.) can be used on websites, blogs, articles, presentations, offers, social media, or your own research, citing Prehost.com as the source along with an active link.
Press release: Digital Impatience: The Hidden Epidemic Costing Companies Millions – Latest Research
How important is it?
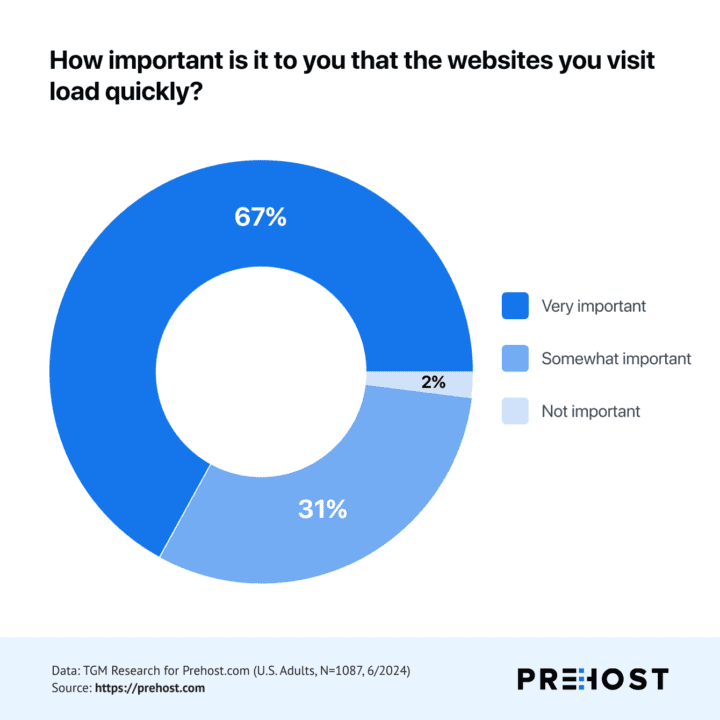
Question: How important is it to you that the websites you visit load quickly?
| ANSWER | % |
|---|---|
| Not important | 2% |
| Somewhat important | 31% |
| Very important | 67% |
AGE
| Response | Total | 18-29 | 30-44 | 45-59 | 60-75 |
|---|---|---|---|---|---|
| Not important | 2% | 3% | 1% | 1% | 3% |
| Somewhat important | 31% | 31% | 26% | 29% | 41% |
| Very important | 67% | 66% | 73% | 70% | 56% |
GENDER
| Response | Total | Male | Female |
|---|---|---|---|
| Not important | 2% | 2% | 2% |
| Somewhat important | 31% | 31% | 31% |
| Very important | 67% | 67% | 67% |
REGION
| Response | Total | West | Midwest | South | Northeast |
|---|---|---|---|---|---|
| Not important | 2% | 1% | 1% | 3% | 3% |
| Somewhat important | 31% | 34% | 28% | 30% | 31% |
| Very important | 67% | 65% | 71% | 67% | 66% |
INCOME
| Response | Total | Up to USD 1,250 | From USD 1,251 to USD 3,500 | From USD 3,501 to USD 7,000 | USD 7,001 and more |
|---|---|---|---|---|---|
| Not important | 2% | 3% | 2% | * | 3% |
| Somewhat important | 31% | 33% | 33% | 24% | 28% |
| Very important | 67% | 64% | 65% | 76% | 69% |
EDUCATION
| Response | Total | Primary education | Secondary education | Post secondary education | Tertiary education (bachelor degree) | Masters / Doctorate degree |
|---|---|---|---|---|---|---|
| Not important | 2% | 3% | 3% | 2% | 1% | 1% |
| Somewhat important | 31% | 38% | 31% | 32% | 28% | 25% |
| Very important | 67% | 59% | 65% | 67% | 71% | 74% |
Impact on decisions and behaviors
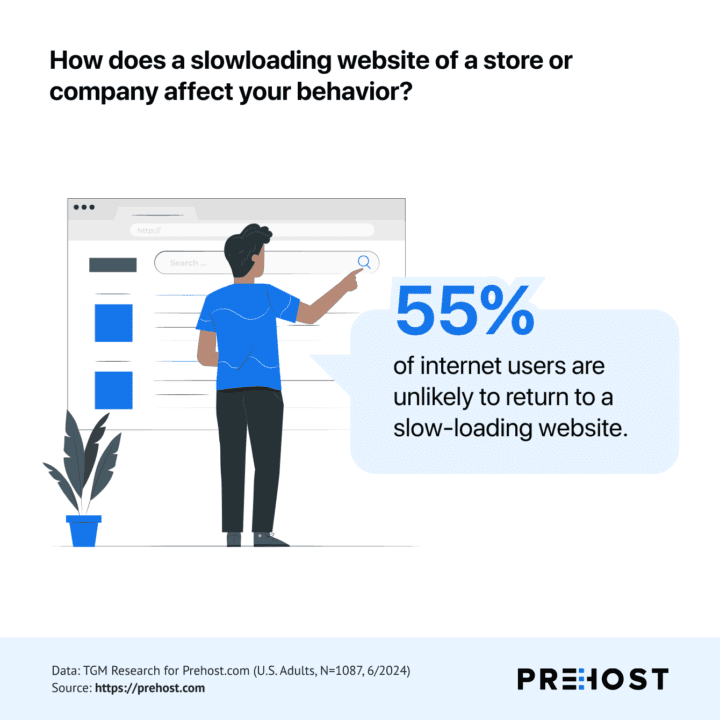
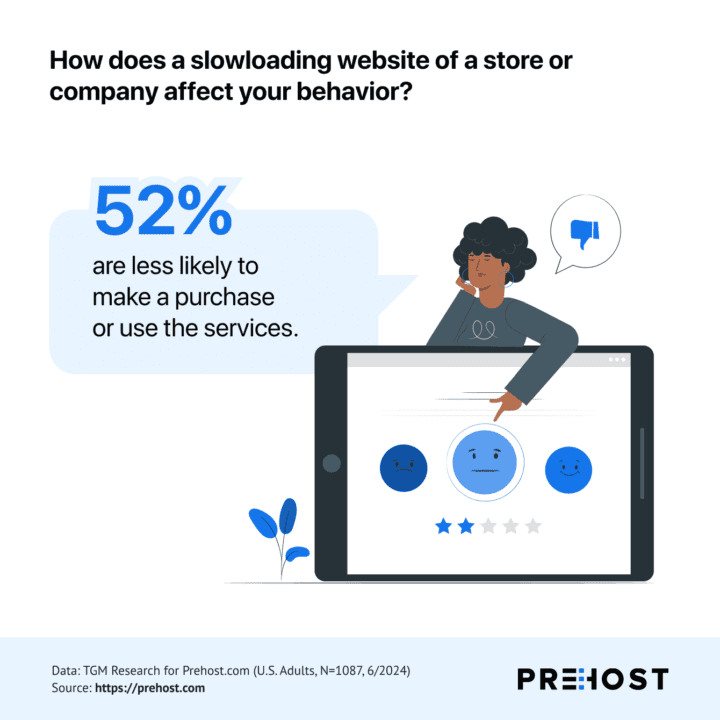
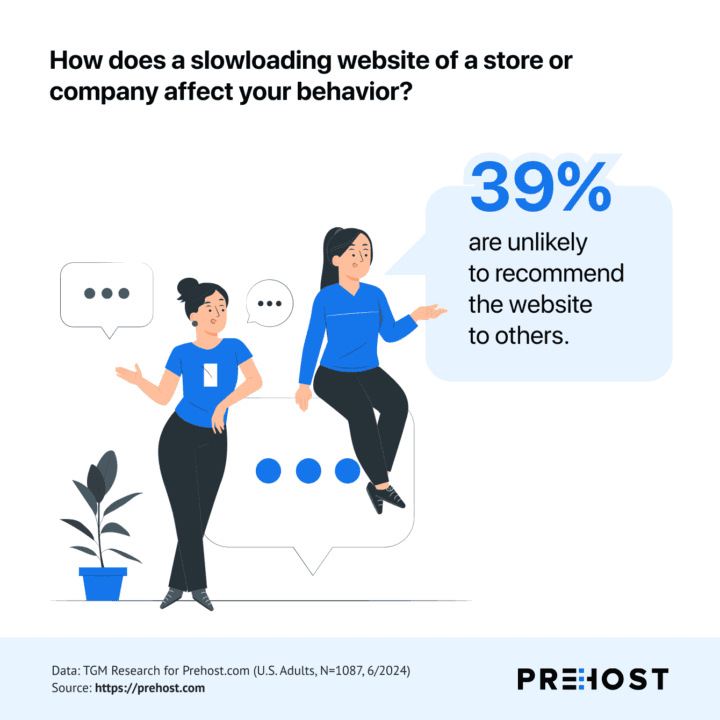
Question: How does a slow-loading website of a store or company affect your behavior?
| ANSWER | % |
|---|---|
| I am less likely to make a purchase or use the services | 52% |
| I am less likely to return to this website in the future | 55% |
| I am less likely to recommend this website to others | 39% |
| None of the above | 11% |
AGE
| Response | Total | 18-29 | 30-44 | 45-59 | 60-75 |
|---|---|---|---|---|---|
| I am less likely to make a purchase or use the services | 52% | 57% | 53% | 54% | 42% |
| I am less likely to return to this website in the future | 55% | 58% | 53% | 56% | 55% |
| I am less likely to recommend this website to others | 39% | 43% | 42% | 38% | 30% |
| None of the above | 11% | 10% | 10% | 11% | 15% |
GENDER
| Response | Total | Male | Female |
|---|---|---|---|
| I am less likely to make a purchase or use the services | 52% | 53% | 50% |
| I am less likely to return to this website in the future | 55% | 58% | 52% |
| I am less likely to recommend this website to others | 39% | 43% | 35% |
| None of the above | 11% | 10% | 12% |
REGION
| Response | Total | West | Midwest | South | Northeast |
|---|---|---|---|---|---|
| I am less likely to make a purchase or use the services | 52% | 56% | 54% | 49% | 50% |
| I am less likely to return to this website in the future | 55% | 51% | 63% | 52% | 57% |
| I am less likely to recommend this website to others | 39% | 34% | 39% | 42% | 38% |
| None of the above | 11% | 13% | 10% | 11% | 11% |
INCOME
| Response | Total | Up to USD 1,250 | From USD 1,251 to USD 3,500 | From USD 3,501 to USD 7,000 | USD 7,001 and more |
|---|---|---|---|---|---|
| I am less likely to make a purchase or use the services | 52% | 52% | 49% | 53% | 57% |
| I am less likely to return to this website in the future | 55% | 51% | 60% | 55% | 54% |
| I am less likely to recommend this website to others | 39% | 37% | 42% | 36% | 40% |
| None of the above | 11% | 12% | 11% | 11% | 10% |
EDUCATION
| Response | Total | Primary education | Secondary education | Post secondary education | Tertiary education (bachelor degree) | Masters / Doctorate degree |
|---|---|---|---|---|---|---|
| I am less likely to make a purchase or use the services | 52% | 44% | 43% | 52% | 60% | 70% |
| I am less likely to return to this website in the future | 55% | 45% | 53% | 58% | 57% | 52% |
| I am less likely to recommend this website to others | 39% | 27% | 35% | 41% | 44% | 35% |
| None of the above | 11% | 13% | 11% | 12% | 11% | 6% |
Declared waiting time for the webpage to load
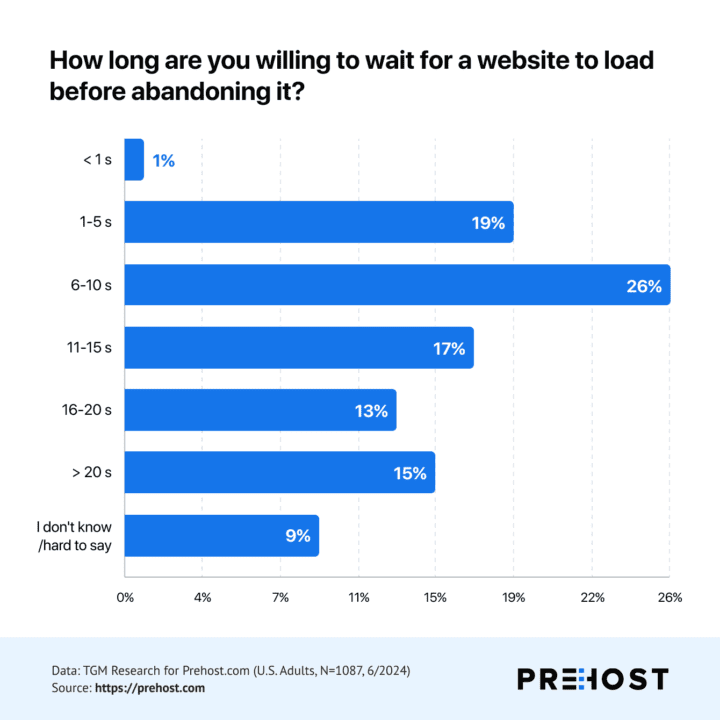
Question: How long are you willing to wait for a website to load before abandoning it?
| ANSWER | % |
|---|---|
| Less than 1 second | 1% |
| 1–5 seconds | 19% |
| 6–10 seconds | 26% |
| 11–15 seconds | 17% |
| 16–20 seconds | 13% |
| More than 20 seconds | 15% |
| I don’t know / hard to say | 9% |
AGE
| Response | Total | 18-29 | 30-44 | 45-59 | 60-75 |
|---|---|---|---|---|---|
| Less than 1 second | 1% | 2% | 1% | 2% | * |
| 1–5 seconds | 19% | 19% | 18% | 21% | 16% |
| 6–10 seconds | 26% | 22% | 26% | 27% | 28% |
| 11–15 seconds | 17% | 16% | 18% | 15% | 20% |
| 16–20 seconds | 13% | 19% | 15% | 11% | 8% |
| More than 20 seconds | 15% | 17% | 17% | 15% | 12% |
| I don’t know/ hard to say | 9% | 5% | 5% | 10% | 16% |
GENDER
| Response | Total | Male | Female |
|---|---|---|---|
| Less than 1 second | 1% | 1% | 1% |
| 1–5 seconds | 19% | 19% | 18% |
| 6–10 seconds | 26% | 28% | 24% |
| 11–15 seconds | 17% | 17% | 17% |
| 16–20 seconds | 13% | 14% | 12% |
| More than 20 seconds | 15% | 13% | 18% |
| I don’t know/ hard to say | 9% | 7% | 10% |
REGION
| Response | Total | West | Midwest | South | Northeast |
|---|---|---|---|---|---|
| Less than 1 second | 1% | 2% | 2% | 1% | 1% |
| 1–5 seconds | 19% | 21% | 15% | 19% | 19% |
| 6–10 seconds | 26% | 25% | 25% | 28% | 23% |
| 11–15 seconds | 17% | 14% | 19% | 16% | 20% |
| 16–20 seconds | 13% | 13% | 16% | 13% | 12% |
| More than 20 seconds | 15% | 17% | 16% | 14% | 14% |
| I don’t know/ hard to say | 9% | 9% | 8% | 7% | 11% |
INCOME
| Response | Total | Up to USD 1,250 | From USD 1,251 to USD 3,500 | From USD 3,501 to USD 7,000 | USD 7,001 and more |
|---|---|---|---|---|---|
| Less than 1 second | 1% | 4% | 1% | * | 1% |
| 1–5 seconds | 19% | 18% | 18% | 20% | 19% |
| 6–10 seconds | 26% | 22% | 29% | 27% | 25% |
| 11–15 seconds | 17% | 15% | 19% | 20% | 12% |
| 16–20 seconds | 13% | 12% | 13% | 16% | 15% |
| More than 20 seconds | 15% | 16% | 14% | 14% | 17% |
| I don’t know/ hard to say | 9% | 13% | 7% | 3% | 12% |
EDUCATION
| Response | Total | Primary education | Secondary education | Post secondary education | Tertiary education (bachelor degree) | Masters / Doctorate degree |
|---|---|---|---|---|---|---|
| Less than 1 second | 1% | 2% | 3% | 1% | 1% | * |
| 1–5 seconds | 19% | 13% | 18% | 19% | 17% | 25% |
| 6–10 seconds | 26% | 28% | 28% | 25% | 25% | 26% |
| 11–15 seconds | 17% | 11% | 16% | 15% | 22% | 17% |
| 16–20 seconds | 13% | 14% | 14% | 13% | 14% | 12% |
| More than 20 seconds | 15% | 19% | 13% | 17% | 16% | 13% |
| I don’t know/ hard to say | 9% | 14% | 8% | 10% | 6% | 7% |
Results of the Study – Infographic
Below is an infographic summarizing the key findings from the study:
If you have any questions or concerns regarding the study and its results, please feel free to contact us.
